Smartsheet Dashboards: How to Build One That Holds Up
A good Smartsheet dashboard starts in the sheet, not on the dashboard. First put the numbers you want into sheet summary fields or a report. Then create the dashboard and point each widget at that prepared source. If you build widgets first, you end up fixing them every time someone adds a row.
I have built and rebuilt a lot of these for project teams. The ones that last all follow the same order. This guide walks you through it, with the real plan limits from Smartsheet’s pricing page and help center, checked in October 2026.
The one rule that shapes everything
A chart widget can only read from one sheet or one report. Smartsheet says this plainly in its widget types guide. You cannot draw one chart from five project sheets at once.
So if your data lives on many sheets, you must pull it together first. You have three ways to do that:
- Sheet summary fields. These hold one value each, like “% complete” or “open risks.” The metric widget reads them by name. Because they are named, not tied to a cell, they do not break when rows move. This is the best choice for headline numbers.
- Reports. A report gathers rows from many sheets into one view. Chart and report widgets can both read a report. On Business and above, a report can also group and total rows, which is what most charts need.
- A roll-up sheet with cross-sheet formulas. Use SUMIFS or COUNTIFS with cross-sheet references to pull totals onto one sheet. Then chart that sheet.
Check every number in the sheet or report before you open the dashboard. If a number is wrong at the source, no widget setting will fix it.
Plan limits that matter
| Pro | Business | Enterprise | |
|---|---|---|---|
| Price (billed yearly) | $9 per member/month | $19 per member/month | Custom |
| Widgets per dashboard | 10 | Unlimited | Unlimited |
| Sheets per report | 1 | Unlimited | Unlimited |
| Publish dashboard to a link | No | Yes | Yes |
| Automations | 250 per month | Unlimited | Unlimited |
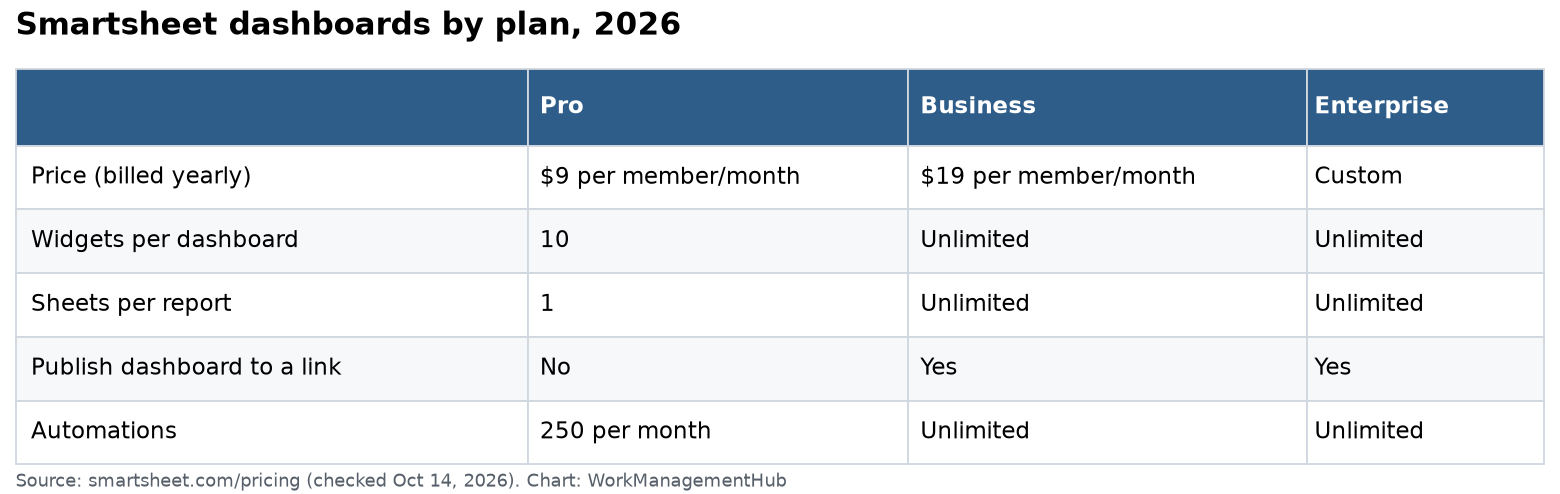
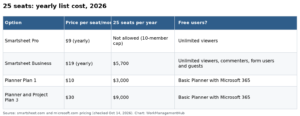
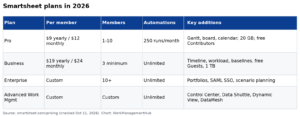
The Pro limits are the big trap. A report on Pro can only read one sheet. That means a true multi-project dashboard is not possible on Pro, no matter how you arrange the widgets. If someone asks for a portfolio dashboard, check the plan first. Our Smartsheet pricing breakdown shows what the upgrade costs.
Step 1: Create the dashboard
- On the Home screen (full steps are in Smartsheet’s dashboard guide), select +Create on the left.
- Choose Dashboard. Save it in the same workspace as its source sheets. Sharing then follows the workspace, so you do not have to share each sheet by hand.
- Name it and select OK.
- You can describe what you want in the AI prompt box, or choose Build dashboard manually. The AI route lets you pick up to five sheets and suggests charts. For anything a leadership group will question, build it by hand. You need to know which cells made each number.
- Select Save.
Step 2: Add the right widgets
Select Edit Dashboard at the top right. Then add widgets from the right-hand panel.
- Metric: for one big number. Choose Sheet Summary data over Grid data. Grid data points at a cell position. If someone inserts a row above it, the widget quietly shows the wrong value.
- Report: when people need to see the actual rows. You need Admin rights on the report to place it. Viewers of the dashboard can often see the rows without access to the source sheets.
- Rich text: for two or three sentences on why the numbers moved. Leaders read this first. The charts are how they check it.
- Shortcut: for the few links people really use, such as the risk log or the change request form. Use one shortcut widget, not ten scattered links.
- Web content: for an embedded form, video, or Tableau view.
- Title and Image: to label sections and add a logo. Keep the logo small.
For each widget, open Widget Behavior and set what a click does. Setting metric widgets to open the source sheet saves a lot of “where did this number come from?” questions.
When you finish, right-click the canvas and choose Consolidate Empty Space to close gaps. Then save.
Step 3: Build a chart that reads clean
- In edit mode, add a Chart widget.
- Select Add Data first. You cannot pick a chart type until you choose data.
- Pick the sheet or report, select the cell range, and click OK.
- Pick a type. Smartsheet offers line, bar, column (plain and stacked), pie, donut and scatter.
- Open Columns Included and untick anything you do not want plotted. This is the most useful setting, and the one most people miss.
- If the axes look flipped, use Switch rows/columns.
- Under Viewer mode, choose Last widget editor or Their own perspective. This decides whose view of the data other people see. It matters if row access differs between viewers.
Two things catch people here. Pie and donut charts skip zero values, so an empty status slice simply vanishes. And charts only read number-type values. A “% Complete” column stored as text will chart as nothing.
Step 4: Share and publish
Dashboards have only two sharing levels: Admin and Viewer. There is no Editor level. Anyone you make an Admin can change every widget. Smartsheet explains this in its dashboard sharing guide.
To show it to people without a Smartsheet login, go to File > Publish and turn it on. Under Security Controls, you can limit the link to people on your plan. Save first, because the last saved version is what gets published.
What experienced builders do differently
- They push the math into the sheet. A dashboard with 8 widgets fed by summary fields loads faster than one with 30 widgets reading big raw ranges.
- They publish from a service account. A published link stops working if the person who published it loses access. When that person leaves, the link breaks. Publish from an account that will outlast any one employee.
- They test on a phone. The mobile app swaps custom colors for the nearest default colors. A red, amber, green scheme can look wrong. Use labels and shapes, not color alone.
- They write the “why” in text. Charts show what moved. A short note says why.
Card view on dashboards: Card view was retired on standalone sheets in fall 2026, but it still works in dashboards built on a published sheet or report. Board view can’t be published yet. See our Smartsheet card view retirement guide before you rebuild a dashboard.
Limits to plan around
- Refresh is every 10 minutes for published dashboards. You cannot change it. That is fine for weekly status, but not for live operations.
- Web content widgets do not auto-refresh. An embedded Tableau view stays as it was until the viewer reloads.
- Metric widgets do not pick up new summary fields. Add a new field to the sheet, and you must add it to the widget by hand.
- Theme colors skip report and web content widgets. Those panels keep their own look.
When NOT to use a dashboard
- When people need to edit their own rows. A dashboard is for reading. If each person should update only their records, look at Dynamic View instead. It is an add-on on Business and Enterprise.
- When you need real analysis. Multi-year trends, joins across systems, or stats work belong in Power BI or Tableau. Keep Smartsheet as the system of record.
- When a report is enough. Delivery teams usually want the rows, not a picture of them. Dashboards earn their keep when the audience would never open Smartsheet otherwise.
My view: for most teams, a Business plan dashboard with 6 to 10 widgets, all fed by sheet summary fields and one report, beats a crowded 25-widget wall every time.
Common questions
Can a Smartsheet chart pull data from more than one sheet?
No. A chart reads one sheet or one report. To combine data, build a report that pulls the rows together, or use cross-sheet formulas on a roll-up sheet. Then chart that.
How often does a Smartsheet dashboard refresh?
A published dashboard refreshes every 10 minutes, and you cannot change that. Inside Smartsheet, each person sets their own auto-refresh under the View menu. Web content widgets do not refresh on their own.
Which plan do I need for dashboards?
Pro, Business and Enterprise can all create dashboards. Pro caps you at 10 widgets per dashboard and 1 sheet per report. For a multi-project dashboard, you realistically need Business or higher.
Can people without a Smartsheet account see my dashboard?
Yes, if you publish it on Business or Enterprise. Publishing makes a link that works without a login. A system admin can turn publishing off for the whole account.
Why does my metric widget show the wrong number?
It is probably bound to grid data, which points at a cell position. When someone adds or deletes rows above it, the widget reads a different cell. Rebuild it on sheet summary data, which uses named fields.
How many widgets should a dashboard have?
Six to ten is a good target. Past that, it loads slower and people stop reading it. Split big dashboards by audience instead.
Plan limits and steps checked against smartsheet.com and the Smartsheet help center on October 14, 2026. Vendors change plans; confirm before you buy.
From our team: OneSmar for Smartsheet Teams