How to Use the Smartsheet AI Dashboard Builder in 2026: Prompts, Limits and Admin Settings

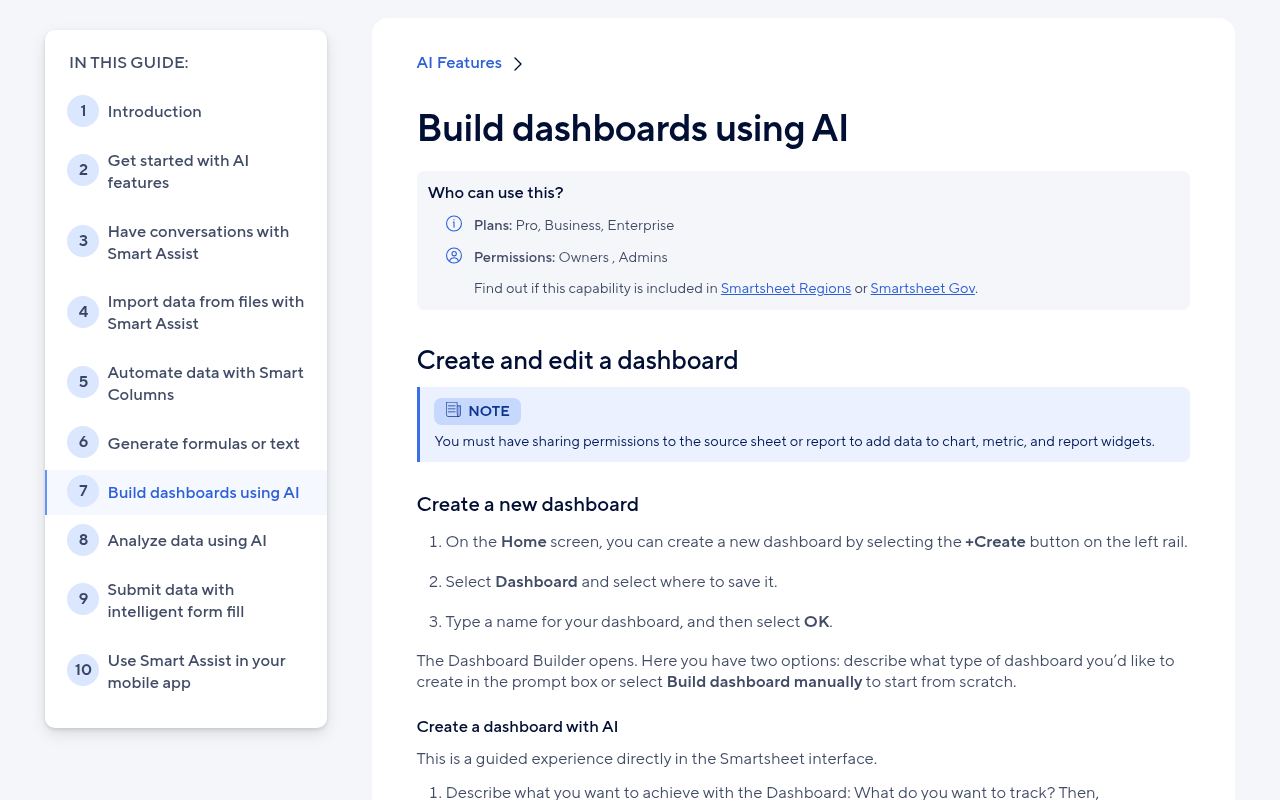
The Smartsheet AI dashboard builder makes a dashboard from a plain-English prompt. Select +Create, then Dashboard, name it, and describe what you want to track. Pick up to five source sheets. Smartsheet suggests charts (up to ten per dashboard build), and you keep the ones you like. The help page lists it on Pro, Business and Enterprise for sheet Owners and Admins, and the pricing page also lists it on Advanced Work Management.
This guide follows Smartsheet’s help on building dashboards with AI, AI Management in Admin Center and creating and editing dashboards, plus the Smartsheet pricing page, checked on October 16, 2026.
The key numbers
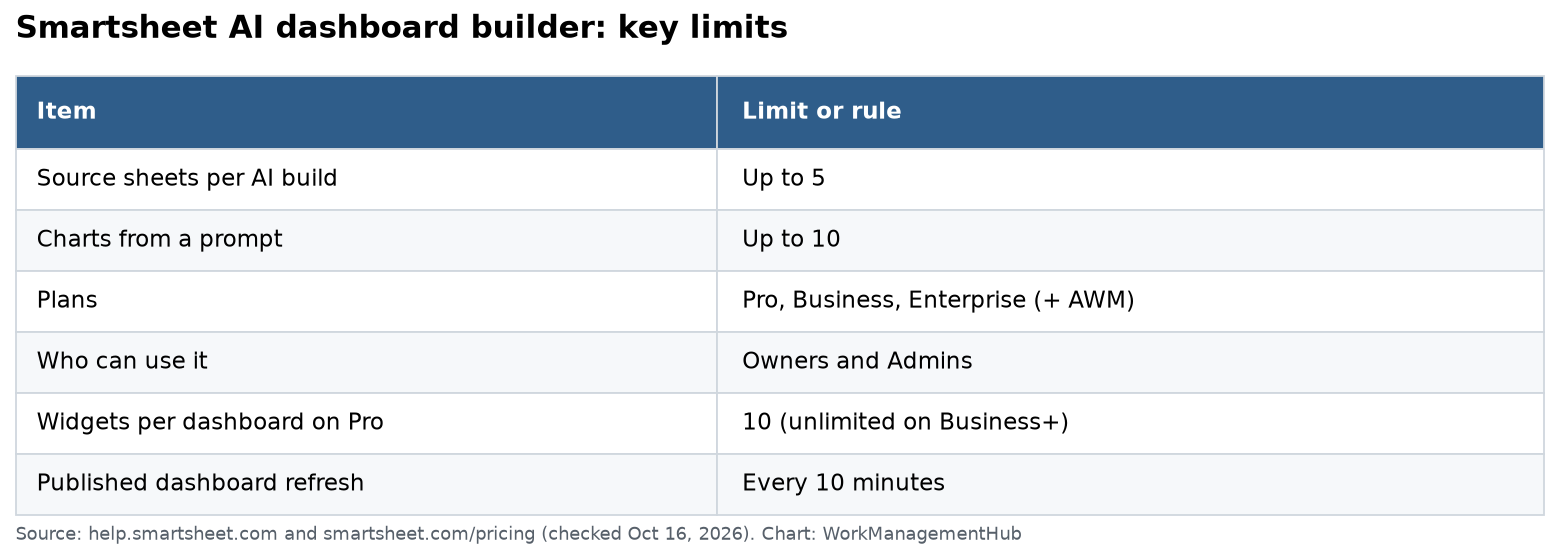
| Item | Limit or rule |
|---|---|
| Source sheets per AI build | Up to 5 |
| Charts the builder can create | Up to 10 per prompt |
| Plans | Pro, Business, Enterprise (pricing page adds Advanced Work Management) |
| Who can use it | Owners and Admins |
| Widgets per dashboard on Pro | 10 (unlimited on Business and up) |
| Auto-refresh of a published dashboard | Every 10 minutes |
| Who controls it | System Admins, plan-wide, in AI Management |
| Smartsheet Gov | AI Management not available |
Watch the Pro limit. Pro dashboards allow only 10 widgets. If the AI suggests 10 charts and you also want a title and a metric widget, you will hit the cap. Business removes it. See our Smartsheet pricing guide for what else changes by plan.
Before you start: prepare your sheet
The AI reads your column names and values. Clean data gives better charts. Do these three things first:
- Rename generic columns. “Column2” means nothing to the AI. “Owner,” “Due date” and “Status” do.
- Use the right column types. Dates as Date columns, statuses as dropdowns, numbers as numbers.
- Check sharing. You must have sharing permissions on each source sheet or report to add its data to chart, metric or report widgets.
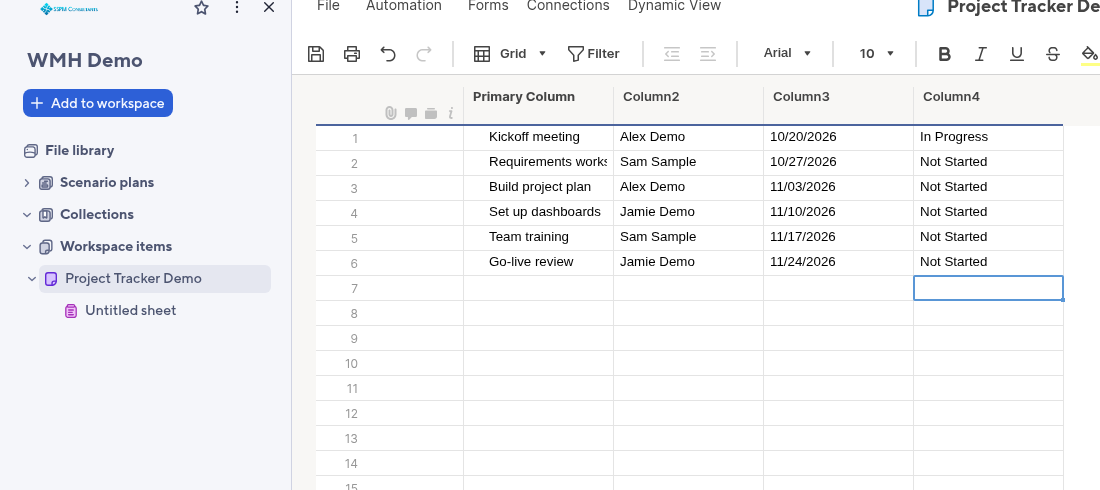
In the demo sheet above, Column2 holds owners, Column3 holds dates and Column4 holds statuses. Renaming those to Owner, Due date and Status takes ten seconds and makes every prompt work better.
Build a dashboard with AI, step by step
- On the Home screen, select +Create on the left rail.
- Select Dashboard and pick where to save it.
- Type a name, then select OK. The Dashboard Builder opens.
- In the prompt box, describe what you want to track. Then select Create.
- Select your data source. You can pick up to five sheets.
- Smartsheet generates charts based on your prompt. Select the ones to add, or type another prompt to get closer to what you want.
- Select Save in the upper right.
Prefer to start blank? Select Build dashboard manually instead. You can still add AI charts later with the AI Chart widget.
Prompts that work
Be specific about the measure, the grouping and the audience. Here are prompts written for a project tracker like the demo sheet:
- “Show tasks by status, and tasks due in the next 14 days by owner, for a weekly team check-in.”
- “Compare open vs done tasks by owner as a bar chart.”
- “Show how many tasks are due each week this quarter.”
Weak prompts are vague, like “make a dashboard for my project.” The AI then guesses what matters. If the first set of charts misses, do not start over. Type a second prompt that says what to change.
Refine an AI chart
- In the toolbar, select Edit Dashboard.
- Double-click any AI-created chart. This opens conversational editing.
- Type a refinement prompt, like “Make this a stacked bar and sort by owner.”
- Select Save when done.
To change colors and fonts by hand on an AI chart, open Widget Settings. You may need to select Edit [widget type] styles first.
Dashboard Owners and Admins can add and edit widgets, change themes and widen the canvas. You can save up to 39 custom colors in the dashboard color picker.
Admin controls: turning AI on or off
System Admins manage this in Admin Center, on the AI Management page. Two toggles matter here:
- AI dashboard builder: create dashboards with up to ten charts from a prompt.
- AI-powered charts for dashboards: AI chart creation and editing inside the builder.
Know these rules before you change them:
- Toggles apply to everyone on the plan. You cannot scope them to certain users or groups.
- Turning a feature off does not remove what exists. AI charts already on dashboards keep working.
- AI Management is not available in Smartsheet Gov.
The same page also controls other AI features and MCP connectors. Our Smartsheet AI features guide covers Smart Assist and Smart Columns, and our Smartsheet MCP and Claude guide covers the connectors.
Tips from real use
- Check every number. AI charts use your data, but they can group or filter it in ways you did not intend. Compare one chart total with a sheet summary before you share.
- Use reports as sources for large or mixed data. A report can pull rows from many sheets, which gets around the five-sheet limit. Note that Pro allows one sheet per report.
- Title charts for the reader. Rename “Count of Status” to “Tasks by status this week.”
- Remember the refresh. Published dashboards refresh every 10 minutes, and you can’t change that for others. Web content widgets do not refresh.
For a full manual build with metric widgets and layouts, see our Smartsheet dashboards guide.
AI build or manual build?
The AI builder is not always the faster path. Here is a simple way to decide:
- Use AI when you need a first draft fast, your data sits in a few clean sheets, and you are not sure which charts tell the story.
- Build by hand when the dashboard is for leaders, must match a fixed layout, or pulls from many sheets through reports.
- Mix both. Let AI create the charts, then add metric widgets, titles and links yourself. Most teams end up here.
Whichever route you take, ask one person who will read the dashboard to review it before you share it widely.
Common questions
Which Smartsheet plans include the AI dashboard builder?
Pro, Business and Enterprise, per the help page. The pricing page also lists it on Advanced Work Management. You need Owner or Admin permission.
How many sheets can the AI dashboard builder use?
Up to five source sheets per build. Use a report if you need more data in one place.
How many charts does it create?
Up to ten charts from a prompt. You choose which to add.
Can admins turn it off for some users only?
No. AI Management toggles apply to everyone on the plan.
What happens to AI charts if the feature is turned off?
They keep working. Turning a capability off does not remove existing content.
Checked against help.smartsheet.com (AI dashboard builder, AI Management, Create and edit a dashboard) and smartsheet.com/pricing on October 16, 2026. This guide has no affiliate links.
Sponsored

Related guides