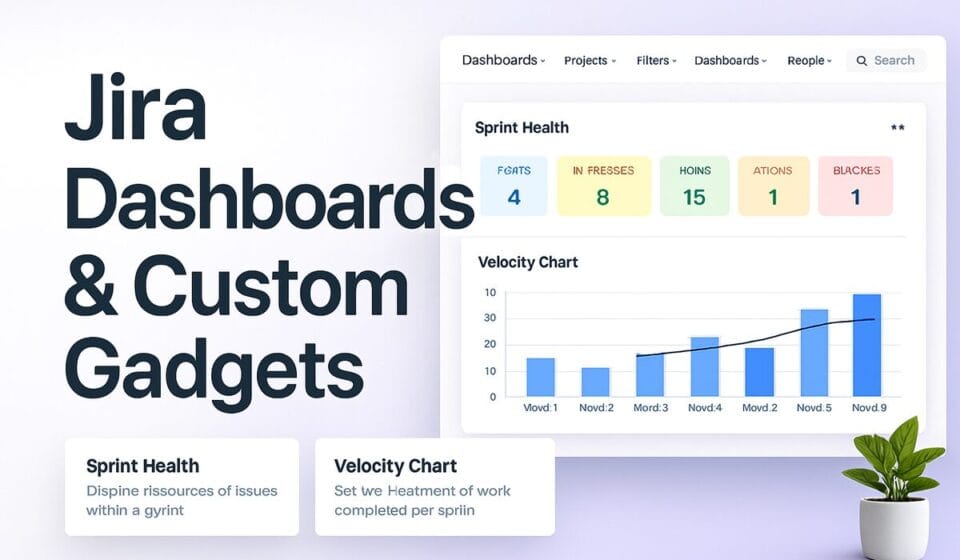

- Jira dashboards in 2026 are fully configurable boards built from gadgets — you create them privately by default and share via the three-dot menu, then Edit Dashboard, then Viewers/Editors permissions.
- The optimal dashboard has 4 to 6 gadgets; adding more degrades load performance and reduces the signal-to-noise ratio for your team.
- Jira Cloud’s new AI Summary gadget (2026) generates a plain-English sprint health report automatically — but it requires a Jira Premium plan and Atlassian Intelligence enabled.
- The Activity Stream gadget tracks all project updates — not just issues assigned to you — making it the most powerful but most misunderstood gadget on most dashboards.
- You need Dashboard Owner permissions to edit a dashboard; viewers can only see it. To edit someone else’s dashboard you must be granted Editor rights or clone it.
- Gadget refresh rates vary: Assigned to Me updates in real time; Velocity Chart and Created vs. Resolved require manual refresh. Knowing which is which prevents decisions based on stale data.
To create a Jira dashboard in 2026, go to Dashboards, select Create dashboard, name it, then click Add gadget to build your layout. Choose gadgets like Sprint Health, Assigned to Me, or Velocity Chart. Share via the three-dot menu, then Edit Dashboard, then set Viewers and Editors. Keep it to 4 to 6 gadgets for best performance.
- What Are Jira Dashboards and Why They Matter in 2026
- How to Create a Jira Dashboard (Step-by-Step)
- Adding and Configuring Gadgets
- The Best Jira Gadgets Explained: What Each One Actually Does
- The New AI Summary Gadget in 2026: Setup and Limitations
- How to Share Jira Dashboards and Set Permissions
- Dashboard Performance: Why Too Many Gadgets Kill Productivity
- Gadget Refresh Rates and Data Currency
- Recommended Dashboard Templates by Use Case
- Common Mistakes Teams Make With Jira Dashboards
- Verdict
- Frequently Asked Questions
How to Create Jira Dashboards and Custom Gadgets in 2026: Complete Setup Guide
Jira dashboards are one of the most underused features in the entire platform — not because teams do not want visibility into their work, but because most guides show screenshots of the old Jira Server interface or stop at “add a gadget.” In 2026, Jira Cloud dashboards are considerably more powerful than they were two years ago, and the addition of the AI Summary gadget changes what is possible for sprint reporting. This guide covers everything: creating dashboards from scratch in the current Jira Cloud UI, understanding what each gadget actually shows, sharing with the right permissions, and building a lean, high-performance dashboard your team will actually use.
If you are managing sprints alongside your dashboards, our guide on Jira sprint planning in 2026 covers the upstream work that makes dashboard data meaningful.
What Are Jira Dashboards and Why They Matter in 2026
A Jira dashboard is a configurable home screen made up of individual information panels called gadgets. Each gadget pulls live data from your Jira projects and displays it in a specific format — a chart, a list, a count, or a summary. You can arrange gadgets in two or three column layouts, resize them, and configure each one to filter data by project, user, sprint, or date range.
Dashboards sit at the intersection of project management and business reporting. A well-built dashboard tells a team lead — at a glance, without drilling into individual tickets — whether a sprint is healthy, whether blockers are piling up, and whether work is being created faster than it is being resolved. A poorly built dashboard is noise: a wall of slow-loading charts that nobody trusts because the data might be stale.
In 2026, Jira Cloud dashboards are meaningfully different from the Jira Server dashboards you might see in older tutorials. The interface is cleaner, the gadget library has expanded, sharing permissions are more granular, and the AI Summary gadget (Premium only) adds a qualitative layer that no chart can replicate. The core mental model — a configurable board of data widgets — is the same, but the execution has matured considerably.
Dashboards in Jira Cloud are private by default. They live in your personal Jira space until you explicitly share them. This is important to understand from the outset: creating a dashboard does not automatically make it visible to your team. Sharing is a separate, deliberate step covered in detail later in this guide.
How to Create a Jira Dashboard (Step-by-Step)
This section covers the current Jira Cloud interface as of 2026. If you are seeing a different UI, confirm you are on Jira Cloud — these steps do not apply to Jira Data Center or Server.
- Open the Dashboards menu — In the Jira top navigation bar, click Dashboards. If you do not see it, click the grid icon on the far left and select Jira from the app switcher, then look for Dashboards in the top nav.
- Click “Create dashboard” — In the Dashboards dropdown, select Create dashboard at the bottom of the list. A modal dialog will appear.
- Name your dashboard — Enter a clear, descriptive name. Use a convention your team will understand: for example, “Engineering Sprint Health — Q3 2026” or “Customer Support Weekly Metrics.” Vague names like “My Dashboard” become a maintenance problem when you have 10 dashboards six months from now.
- Set initial sharing (optional at this stage) — The creation dialog offers a quick Share setting. Leave this as Private for now; you will configure sharing properly after adding gadgets. Click Create.
- Enter the dashboard editor — After creation, Jira immediately opens your new, empty dashboard. You will see a placeholder area prompting you to add your first gadget, along with a layout selector at the top offering one, two, or three column configurations.
- Choose your column layout — Click the layout selector and choose your preferred structure. For most team dashboards, Two columns, left wide is the most practical: it puts your primary gadget (usually Sprint Health or a filter list) in the larger left column and secondary gadgets (counts, velocities, activity) on the right.
Adding and Configuring Gadgets
Gadgets are the building blocks of every Jira dashboard. Adding them is straightforward; configuring them correctly is where most teams go wrong.
- Click “Add gadget” — On your empty dashboard, click the Add gadget button in the top right of the dashboard editor, or in the column placeholder. The gadget library panel slides out from the right side of the screen.
- Browse or search the gadget library — The library shows all available gadgets. You can scroll through categories or use the search bar to find a specific gadget by name. In 2026 Jira Cloud, the library includes native Atlassian gadgets plus any gadgets added by installed Marketplace apps.
- Add a gadget — Click the + icon or Add button next to the gadget you want. It appears on your dashboard immediately in an unconfigured state, usually showing an error or a setup prompt.
- Configure the gadget — Click the gear icon on the gadget (top right of the gadget card) to open its configuration panel. Every gadget has its own settings — at minimum, you will need to specify which project or saved filter to pull data from.
- Select your filter or project — For most gadgets, you choose either a specific Jira project or a saved filter. Saved filters give you more control — you can filter by assignee, label, fix version, sprint, and more — and are reusable across gadgets. If you have not created saved filters yet, set them up at Filters > View all filters > Create filter using Jira Query Language (JQL).
- Set the refresh rate where configurable — Some gadgets let you choose how often they auto-refresh: every 15 minutes, 30 minutes, or manually only. Set this based on how time-sensitive the data is. Sprint counters might refresh every 15 minutes; historical velocity charts only need manual refresh.
- Save the gadget configuration — Click Save in the configuration panel. The gadget immediately populates with data. If it shows “No data available,” verify your filter is returning results by testing it in Jira’s issue search first.
- Reposition gadgets by dragging — Gadgets can be dragged and dropped to different positions within the column layout. Arrange gadgets so the most time-critical information is at the top of each column, reducing the need to scroll during stand-ups or stakeholder reviews.
The Best Jira Gadgets Explained: What Each One Actually Does
Understanding what each gadget is actually showing you is critical before you build a dashboard for your team. Here is an honest breakdown of the gadgets that matter most in 2026.
Sprint Health Gadget
Shows the current sprint’s completion percentage, days remaining, and a breakdown of issues by status. This is the first gadget every agile team should add. It gives an at-a-glance read on whether the sprint is on track or at risk. Configure it to a specific board — it will always pull the active sprint for that board automatically, so you do not need to update it each sprint cycle.
Assigned to Me
A simple list of all issues currently assigned to the logged-in user across all projects or within a specified project filter. This is genuinely real-time — it updates immediately when issues are assigned or resolved. It is the most personal gadget on a dashboard and works well as the first item a team member sees when they open Jira each morning. No saved filter required; just configure the maximum issue count to display.
Activity Stream
This is the most used and least understood gadget in most Jira deployments. The Activity Stream shows a chronological feed of all Jira activity — comments added, issues created, statuses changed, attachments uploaded — across the projects you configure it to watch. Critically, it shows activity from all users across the whole project, not just your own actions. Teams often add this and then complain it is noisy. It is not noisy — it is comprehensive. The fix is to configure it with tight project filters and use the “Filter by user” option to surface only the activity that matters to your role.
Two-Dimensional Filter Statistics
One of the most analytically powerful gadgets in the library, and one of the most underused. It takes a saved filter and lets you cross-tabulate the results by any two fields — for example, issue type versus priority, assignee versus status, or component versus fix version. The output is a matrix table. This is invaluable for capacity planning and identifying where work is bottlenecking. Requires a well-crafted saved filter to be useful. Pair it with your agile Jira setup for the most actionable results.
Created vs. Resolved Chart
A line chart showing the rate at which issues are being created versus the rate at which they are being resolved over a specified time period. If the created line is consistently above the resolved line, your team is falling behind. This is one of the most honest data visualisations in Jira because it is hard to manipulate — the numbers are what they are. Configure it to your primary project with a 30-day window for sprint teams or a 90-day window for support queues.
Velocity Chart
Shows the number of story points or issue count completed per sprint over time. Essential for sprint planning and forecasting. This gadget only refreshes manually — it does not auto-update. Set a team norm to refresh it at the end of each sprint retrospective. For a deeper dive on using velocity data in planning, see our Jira sprint planning guide for 2026.
Issue Statistics
A bar or pie chart showing issues grouped by a single field — status, priority, assignee, component, or label. Simple but effective for one-click overviews. Best used as a secondary gadget to provide context alongside the Sprint Health or Created vs. Resolved gadgets, not as a standalone primary display.
Filter Results
Displays the issues returned by a saved JQL filter in a configurable table format. You choose which columns to show: key, summary, assignee, priority, status, due date, and more. This is the closest thing Jira’s dashboard system has to a custom issue list. Very useful for managers who need to track a specific set of issues — escalations, P1 bugs, items due this week — without navigating to individual project boards.
The New AI Summary Gadget in 2026: Setup and Limitations
The AI Summary gadget is the most significant addition to Jira dashboards in 2026 and the feature most competitor guides fail to cover — largely because it was not available in the Jira Server interface those guides were written against, and because most sites have not updated their coverage since the Premium rollout.
The AI Summary gadget uses Atlassian Intelligence to generate a plain-English paragraph summarising the current state of a sprint or project. Instead of reading a chart and forming your own interpretation, the gadget writes the interpretation for you: “The team is on track to complete 34 of 40 story points by Friday. Three issues are currently blocked, two of which are assigned to the backend team. Velocity is 12% above the three-sprint average.” This is qualitatively different from anything a chart can offer — it surfaces the narrative, not just the numbers.
Requirements for the AI Summary Gadget
- Jira Premium or Enterprise plan — the AI Summary gadget is not available on Standard or Free plans.
- Atlassian Intelligence enabled — must be activated at the organisation level in admin.atlassian.com under Products > Atlassian Intelligence.
- Active sprint on a Jira Software board — the gadget requires a connected board with a running sprint to generate a health summary.
How to Add the AI Summary Gadget
- Confirm Premium plan eligibility — Navigate to Jira Settings > Billing to confirm you are on Premium or Enterprise. If not, the gadget will appear in the library but will prompt an upgrade when you try to configure it.
- Enable Atlassian Intelligence — Go to admin.atlassian.com, select your organisation, then navigate to Products > Atlassian Intelligence and toggle it On. This setting affects all Atlassian products in your organisation, not just Jira.
- Open the gadget library — On your dashboard, click Add gadget and search for “AI Summary.” The gadget will appear with an Atlassian Intelligence badge indicating it requires Premium.
- Add and configure the gadget — Click Add. In the configuration panel, select the Jira Software board whose active sprint you want to summarise. You can also configure the summary depth: brief (two to three sentences) or detailed (a full paragraph covering blockers, velocity, and risk assessment).
- Position the gadget prominently — Place the AI Summary gadget at the top of your left column. It should be the first thing a team lead or stakeholder reads when they open the dashboard. Everything else on the dashboard is the supporting data that backs up what the AI summary states.
How to Share Jira Dashboards and Set Permissions
Every Jira dashboard is private by default. Only the creator can see it until sharing is explicitly configured. Understanding the permission model prevents the most common support question in Jira: “Why can’t my team see the dashboard I made?”
- Open the dashboard options menu — While viewing your dashboard, click the three-dot (ellipsis) menu in the top right corner of the dashboard toolbar.
- Select “Edit dashboard” — This opens the dashboard settings modal. This option is only visible if you are the Dashboard Owner. If you do not see it, you have Viewer permissions on this dashboard — someone else created it and has not granted you edit rights.
- Find the Permissions section — Inside the Edit Dashboard modal, scroll to the Viewers and Editors permission sections. These control who can see the dashboard and who can modify its gadgets.
- Set Viewer permissions — Click Add viewers and choose from the dropdown options: Any logged-in user (anyone in your Jira Cloud site), Group (specific Jira groups such as “developers” or “product-managers”), Project role (all members of a specific role within a project), or Individual user (a specific person by name or email).
- Set Editor permissions — Click Add editors using the same options. Editors can add, remove, and configure gadgets. Be conservative with editor access — too many people editing a shared dashboard leads to gadget sprawl and layout instability within weeks.
- Save the changes — Click Save. The dashboard is now visible and/or editable by the groups you specified. Users with Viewer permissions will see it in their Dashboards recent list once they have visited it, and it can be pinned to their Jira home screen.
For enterprise teams managing multiple project dashboards, consider connecting your dashboard strategy with your Jira Plans (Advanced Roadmaps) setup — Plans provide cross-project programme-level visibility that complements what individual dashboards show at the sprint level.
Dashboard Performance: Why Too Many Gadgets Kill Productivity
This is the section most Jira guides skip, and it is one of the most impactful things a Jira admin can address. Dashboard performance in Jira Cloud degrades measurably as gadget count increases, because each gadget fires a separate API query against your Jira data when the dashboard loads. A dashboard with 12 gadgets is executing 12 concurrent queries every time someone opens it.
The practical symptom: a dashboard that takes 8 to 12 seconds to fully load. Most users will not wait. They will close it, open individual boards, and the dashboard you built becomes worthless because nobody uses it. Dashboard abandonment is the single most common reason teams tell us their Jira visibility improvements “didn’t work.”
The recommended limit is 4 to 6 gadgets per dashboard. This is not an arbitrary number — it is the threshold at which load times remain under three seconds on standard Jira Cloud infrastructure for most organisation sizes. Beyond six gadgets, load time increases non-linearly because Jira Cloud rate-limits dashboard gadget queries to prevent any single dashboard from overwhelming the shared infrastructure.
If you need more than six gadgets’ worth of information, the correct solution is to build multiple purpose-specific dashboards rather than one comprehensive dashboard. For example: a Sprint Health dashboard with four gadgets, a separate Support Metrics dashboard with five gadgets, and an Executive Summary dashboard with three gadgets. Link them from a Confluence page rather than trying to show everything in one place.
Gadgets that are particularly slow to load include: Two-Dimensional Filter Statistics (complex query), Created vs. Resolved (date-range aggregation), and any Filter Results gadget with a large issue count (more than 100 issues returned). If you use these, place them in lower positions on the dashboard so the faster gadgets at the top load first — users see useful information immediately while the heavier gadgets continue loading below the fold.
Gadget Refresh Rates and Data Currency
One of the less-documented characteristics of Jira dashboards is that gadgets do not all update at the same frequency. This matters because making decisions based on what you believe is live data — when it is actually hours old — is worse than having no data at all.
| Gadget | Refresh Behaviour | Typical Data Lag |
|---|---|---|
| Assigned to Me | Real-time (live query on load) | Seconds |
| Sprint Health | Auto-refresh (configurable: 15 to 60 min) | Up to 60 minutes |
| Activity Stream | Auto-refresh (configurable: 15 to 60 min) | Up to 60 minutes |
| Filter Results | Auto-refresh (configurable: 15 to 60 min) | Up to 60 minutes |
| Issue Statistics | Auto-refresh (configurable: 15 to 60 min) | Up to 60 minutes |
| Created vs. Resolved | Manual refresh only | Since last page load |
| Velocity Chart | Manual refresh only | Since last page load |
| Two-Dimensional Filter Statistics | Manual refresh only | Since last page load |
| AI Summary (Premium) | On-demand (generate button) | Generated fresh on request |
Practical implication: if you are using the Velocity Chart or Created vs. Resolved Chart in a stand-up meeting, manually refresh the dashboard before the meeting starts. Do not trust what was loaded an hour ago. The AI Summary gadget, ironically, is one of the freshest data sources on a dashboard — it generates a new summary from live Jira data each time you click its refresh button, rather than serving a cached previous result.
Recommended Dashboard Templates by Use Case
Rather than starting from scratch, here are three proven dashboard configurations that cover the most common use cases in 2026 Jira Cloud deployments. These are starting points — adapt them to your team’s specific data needs.
Agile Sprint Dashboard (4 gadgets)
Purpose: daily team stand-ups and sprint health monitoring. Audience: development team and scrum master.
- Column 1 (wide): Sprint Health gadget (top) plus Filter Results showing open blockers (bottom)
- Column 2 (narrow): Assigned to Me (top) plus Issue Statistics by status (bottom)
Engineering Management Dashboard (5 gadgets)
Purpose: weekly engineering review, capacity planning, and trend analysis. Audience: engineering manager and tech lead.
- Column 1 (wide): AI Summary gadget (top, Premium only) plus Created vs. Resolved Chart (bottom)
- Column 2 (narrow): Velocity Chart (top) plus Two-Dimensional Filter Statistics by assignee vs. status (middle) plus Sprint Health (bottom)
Executive Stakeholder Dashboard (3 gadgets)
Purpose: monthly stakeholder reporting and strategic status updates. Audience: product director, CTO, or client.
- Full width, single column: AI Summary (top) plus Created vs. Resolved with a 90-day window (middle) plus Issue Statistics by epic or component (bottom)
Common Mistakes Teams Make With Jira Dashboards
After reviewing dashboards across dozens of Jira Cloud deployments, the same errors appear repeatedly. Avoiding these will save you hours of troubleshooting and rebuild work.
- Using project-based filters when saved JQL filters are needed. Gadgets configured to show “all issues in Project X” return every issue ever created in that project — often thousands. Always use a saved filter with a meaningful scope: active sprint only, open issues only, issues modified in the last 30 days.
- Sharing a dashboard before it is complete. Once shared with a group, every save to the dashboard is immediately visible to all viewers. Build and configure privately, then share when the dashboard is production-ready.
- Confusing dashboards with boards. Jira boards (Kanban and Scrum) are project-specific workflow views. Dashboards are cross-project reporting surfaces. They serve different purposes and are configured in entirely different parts of the Jira interface. Gadgets display data from boards, but dashboards themselves are not boards.
- Not using saved filters as a shared foundation. If five team members each build dashboards using slightly different JQL, your reporting will be inconsistent. Standardise your JQL filters in Filters > View all filters and share those filters with the team before anyone builds their dashboard. Everyone’s gadgets will then pull from the same data definition.
- Ignoring the Activity Stream gadget’s scope settings. By default, the Activity Stream shows activity across all projects you have access to. For most users, this means seeing activity from dozens of irrelevant projects. Configure it explicitly: set it to two or three specific projects and filter by activity type to make it useful rather than overwhelming.
- Not setting a dashboard owner for team dashboards. When a shared dashboard is owned by an individual and that person leaves the organisation or changes roles, the dashboard becomes uneditable by everyone else. Assign ownership to a service account or Jira admin user for any dashboard intended for long-term team use. Change ownership via the three-dot menu, then Edit Dashboard, then Owner field.
Jira dashboards in 2026 are genuinely useful for sprint visibility and stakeholder reporting — but only when built with discipline. Limit yourself to 4 to 6 gadgets, use saved JQL filters as your data foundation, and make sharing permissions a deliberate decision rather than an afterthought. If you are on Jira Premium, adding the AI Summary gadget to your engineering dashboard is one of the highest-value configuration changes you can make this year: it replaces minutes of chart interpretation with a single, clear paragraph that stakeholders actually read. The teams that get the most from Jira dashboards are not the ones with the most gadgets — they are the ones whose dashboards answer exactly one question per audience, answered clearly, with data that everyone trusts.
Related guides
- How to Set Up Jira Forms in 2026: Build Smart Intake Forms Without an App
- Jira Permissions Not Working? 8 Fixes for the Most Common Access Issues in 2026
- Airtable vs Jira 2026: Which Is Better for Product and Dev Teams?
Frequently Asked Questions
Can I have more than one Jira dashboard?
Yes — there is no hard limit on the number of dashboards you can create in Jira Cloud. You can create separate dashboards for different teams, projects, audiences, or time horizons. The recommended approach is to build purpose-specific dashboards (one for sprint health, one for executive reporting, one for support metrics) rather than a single comprehensive dashboard that tries to serve everyone. Each dashboard can have its own sharing permissions, so a team-level dashboard and an executive-level dashboard can show entirely different information to different audiences from the same Jira data.
Why can’t I edit a Jira dashboard?
You can only edit a dashboard if you are the Dashboard Owner or if the owner has explicitly granted you Editor permissions. If you see a dashboard but cannot add, remove, or configure gadgets, you have Viewer permissions only. To gain Editor access, contact the dashboard owner and ask them to add you under the three-dot menu, then Edit Dashboard, then Editors. If the original owner is no longer available, a Jira Admin can transfer dashboard ownership via the Jira administration panel under System > Shared items > Dashboards — this is one of the few admin-level dashboard actions available in Jira Cloud.
What is the difference between the Sprint Health gadget and the Velocity Chart?
The Sprint Health gadget shows the current sprint in real time: how many issues are done, in progress, or to-do, and how many days remain. It answers whether this sprint is going to succeed. The Velocity Chart is a historical report showing how many story points the team completed per sprint over the past several sprints. It answers how much the team can reliably commit to in future sprints — a backward-looking metric used to calibrate upcoming sprint planning. Both are essential for agile teams, but they answer different questions and should both be present on an engineering management dashboard. For guidance on using velocity data in planning, see our Jira sprint planning guide.
Does the AI Summary gadget replace the need for sprint retrospective meetings?
No — and it should not be positioned that way. The AI Summary gadget summarises quantitative sprint data in plain English: velocity, blockers, completion rates. It does not capture qualitative team feedback, process improvements, or interpersonal dynamics that are the substance of a good retrospective. Think of it as pre-work for the retrospective: by the time the meeting starts, everyone has already read the factual summary and the conversation can focus immediately on root causes and improvements rather than spending the first ten minutes interpreting charts. It reduces meeting prep time significantly without eliminating the need for human reflection.
Can I add gadgets from third-party Marketplace apps to a Jira dashboard?
Yes — many Atlassian Marketplace apps add their own gadgets to the Jira gadget library. Once a Marketplace app with dashboard gadgets is installed and enabled by your Jira admin, those gadgets appear in the Add gadget panel alongside the native Atlassian gadgets. Popular examples include gadgets from apps like Tempo Timesheets (time tracking data), Structure (hierarchy views), and various reporting plugins. Note that Marketplace gadget quality varies significantly — test them on a private dashboard before adding to a shared team dashboard, as some third-party gadgets can be significantly slower to load than native Jira gadgets and can push your dashboard over the 4 to 6 gadget performance threshold. The Atlassian Marketplace gadgets directory lists all available options with user ratings and install counts.
Sponsored